Antibody Epitope Prediction - Tutorial
I. Methods for predicting continuous antibody epitope from protein sequences
General basis: Parameters such as hydrophilicity, flexibility, accessibility, turns, exposed surface, polarity and antigenic
propensity of polypeptides chains have been correlated with the location of continuous epitopes. This has led to a search for empirical rules that
would allow the position of continuous epitopes to be predicted from certain features of the protein sequence. All prediction calculations are based
on propensity scales for each of the 20 amino acids. Each scale consists of 20 values assigned to each of the amino acid residues on the basis of
their relative propensity to possess the property described by the scale.
General method: When computing the score for a given residue i, the amino acids in an interval of the chosen length, centered around residue
i, are considered. In other words, for a window size n, the i - (n-1)/2 neighboring residues on each side of residue i were
used to compute the score for residue i. Unless specified, the score for residue i is the average of the scale values for these amino acids (see
table 1 for specific method implementation details). In general, a window size of 5 to 7 is appropriate for finding regions that may potentially be antigenic.
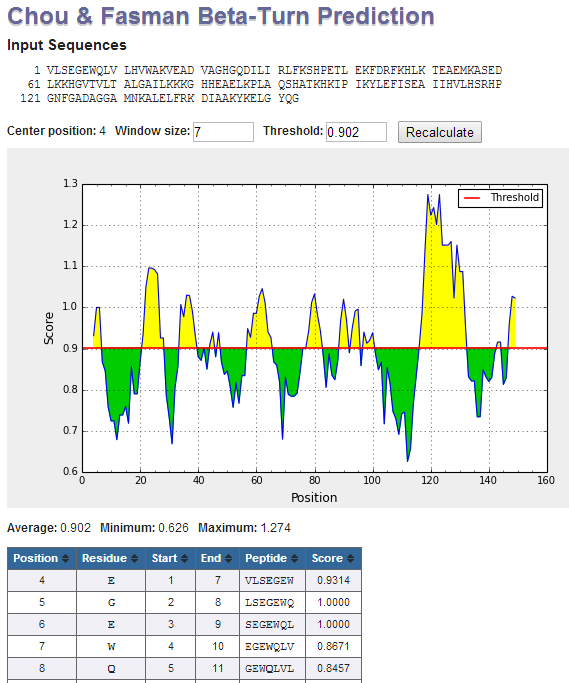
Interpretation of output graphs and tables: On the graphs, the Y-axes depicts for each residue the correspondent score (averaged in the specified window), be it a
BepiPred score or a residue score on the Karplus and Schulz flexibility scale; while the X-axes depicts the residue positions in the sequence. The tables provide values
of calculated scores for each residue. The larger score for the residues might be interpreted as that the residue might have a higher probability to be part of epitope
(those residues are colored in yellow on the graphs). However, the presented methods do not predict the epitopes per se, either linear or discontinuous, -- they might only
guide the researchers to further explore the protein regions on being genuine epitopes.
Table 1. Implemented methods
Method |
||||||||||||||||||||||||||||||||||||||||||||||||||||||||||||||||||
|---|---|---|---|---|---|---|---|---|---|---|---|---|---|---|---|---|---|---|---|---|---|---|---|---|---|---|---|---|---|---|---|---|---|---|---|---|---|---|---|---|---|---|---|---|---|---|---|---|---|---|---|---|---|---|---|---|---|---|---|---|---|---|---|---|---|---|
Chou and Fasman beta turn prediction
|
||||||||||||||||||||||||||||||||||||||||||||||||||||||||||||||||||
Emini surface accessibility scale
|
||||||||||||||||||||||||||||||||||||||||||||||||||||||||||||||||||
Karplus and Schulz flexibility scale
|
||||||||||||||||||||||||||||||||||||||||||||||||||||||||||||||||||
Kolaskar and Tongaonkar antigenicity scale
|
||||||||||||||||||||||||||||||||||||||||||||||||||||||||||||||||||
Parker Hydrophilicity Prediction
|
||||||||||||||||||||||||||||||||||||||||||||||||||||||||||||||||||
Bepipred-1.0 Linear Epitope Prediction
|
||||||||||||||||||||||||||||||||||||||||||||||||||||||||||||||||||
BepiPred-2.0: Sequential B-Cell Epitope Predictor
|
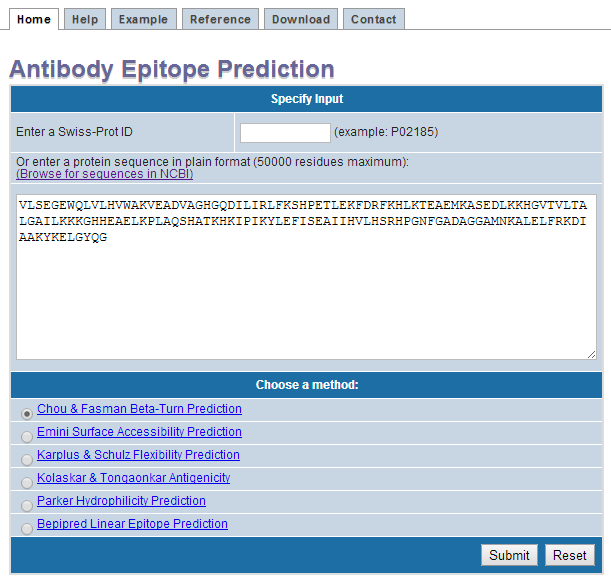
II. Input
- Enter a protein sequence in plain format
- Select a prediction method
- Click submit
III. Output