DiscoTope - Tutorial
Introduction
DiscoTope is a method for predicting discontinuous epitopes from 3D structures of proteins in PDB format (see Reference at the end of the tutorial).
How to use the tool
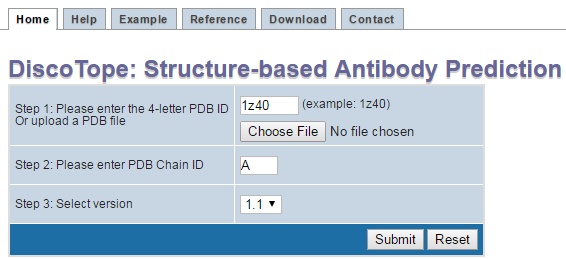
Step 1.
Enter the structure either by entering its PDB id (Each structure in the PDB is represented by a 4 character identifier of the form
[0-9][a-z,0-9][a-z,0-9][a-z,0-9][a-z,0-9]. For example, 4HHB, 9INS are identification codes for PDB entries for hemoglobin and insulin)
Or, by uploading a Structure File in PDB format from your computer.
Step 2.
Enter the Chain id for the protein chain of interest. For example, 4HHB PDB structure has four chains, A, B, C, and D.
Only one chain can be selected to run through the tool. If you want to predict epitopes in a multi-chain protein, for example, considering
the whole oligomer of the hemoglobin (all four chains together), you need to modify a correspondent PDB file (4HHB.pdb) so that all chains
of interest have the same chain ID (specified in the column 22 of the ATOM record in the PDB format file). To avoid conflict of residues
having the same numbers in the modified PDB file, residues might need to be renumbered.
Step 3.
Select DiscoTope version.
Step 4.
Click on submit.
* Note that version 2.0 has not yet been optimized and will therefore take far longer to process your request than 1.1. For a description of the differences between the versions, please click here.
* Note that version 2.0 has not yet been optimized and will therefore take far longer to process your request than 1.1. For a description of the differences between the versions, please click here.
Output
On the following screen, you will be able to see the predicted discontinuous epitopes as a chart of DiscoTope score vs. residue id. Here, you
can change the threshold for predictions, view results in table or 3D viewer, save the prediction result or start with a new prediction.
Chart view
To change the threshold value, enter a different threshold and click on 'Change'. The default value for version 1.1 is -7.7 and version 2.0 is -3.7, which corresponds to a specificity of 75%.
Higher values correspond to higher specificity. A specificity of 0.75 means that 25% of the nonepitope residues were predicted as part of epitopes. A sensitivity
of 0.47 means that 47% of the epitope residues were predicted as part of epitopes.
In a benchmark containing more than 75 antigen/antibody complexes, the following relations were found:
In the chart, predictions above the threshold (red line) are positive predictions (displayed in green) and predictions below the threshold are negative prediction (displayed in orange).
In a benchmark containing more than 75 antigen/antibody complexes, the following relations were found:
DiscoTope-1.1
| Score | Sensitivity | Specificity |
|---|---|---|
| >-3.1 | 0.16 | 0.95 |
| >-4.7 | 0.24 | 0.90 |
| >-6.0 | 0.32 | 0.85 |
| >-6.9 | 0.40 | 0.80 |
| >-7.7 | 0.47 | 0.75 |
DiscoTope-2.0
| Score | Sensitivity | Specificity |
|---|---|---|
| >1.9 | 0.17 | 0.95 |
| >0.5 | 0.23 | 0.90 |
| >-1.0 | 0.30 | 0.85 |
| >-2.5 | 0.39 | 0.80 |
| >-3.7 | 0.47 | 0.75 |
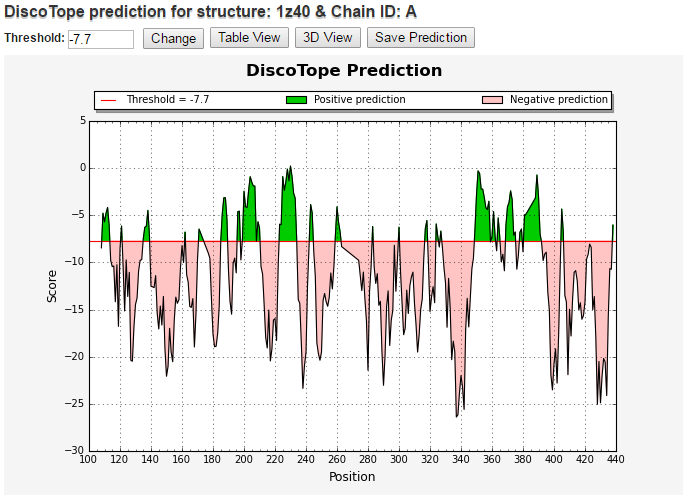
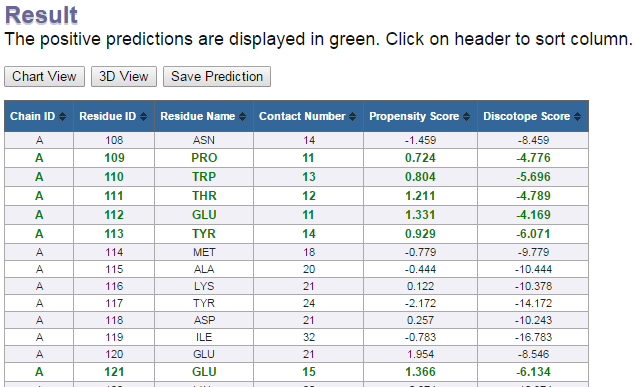
Table view
Table view lists following columns:
- Chain ID:The chain id of the protein chain used in prediction (specified by the user)
- Residue ID:PDB Residue id
- Residue Name:Name of the residue
- Contact Number:The residue contact number is the number of Cα atoms in the antigen within a distance of 10 Å of the residue's Cα atom. A low contact number correlates with localization of the residue close to the surface or in protruding regions of the antigen's structures.
- Propensity Score:This score tells you about the probability/tendency of being part of an epitope for that particular residue. The propensity is reflected in amino acid epitope log-odds ratios, which were calculated on a set of 75 antigens. The propensity score is calculated by sequentially averaging epitope log-odds ratios within a window of 9 residues. Then the scores are summed up based on the proximity in the 3D structure of the antigen. For any given residue, the sequentially averaged log-odds scores from all residues within 10Å are summed to give the propensity score.
- Discotope Score:This score is calculated by combining the contact numbers with propensity score. DiscoTope score above the threshold value indicates positive predictions and that below the threshold value indicates negative predictions.
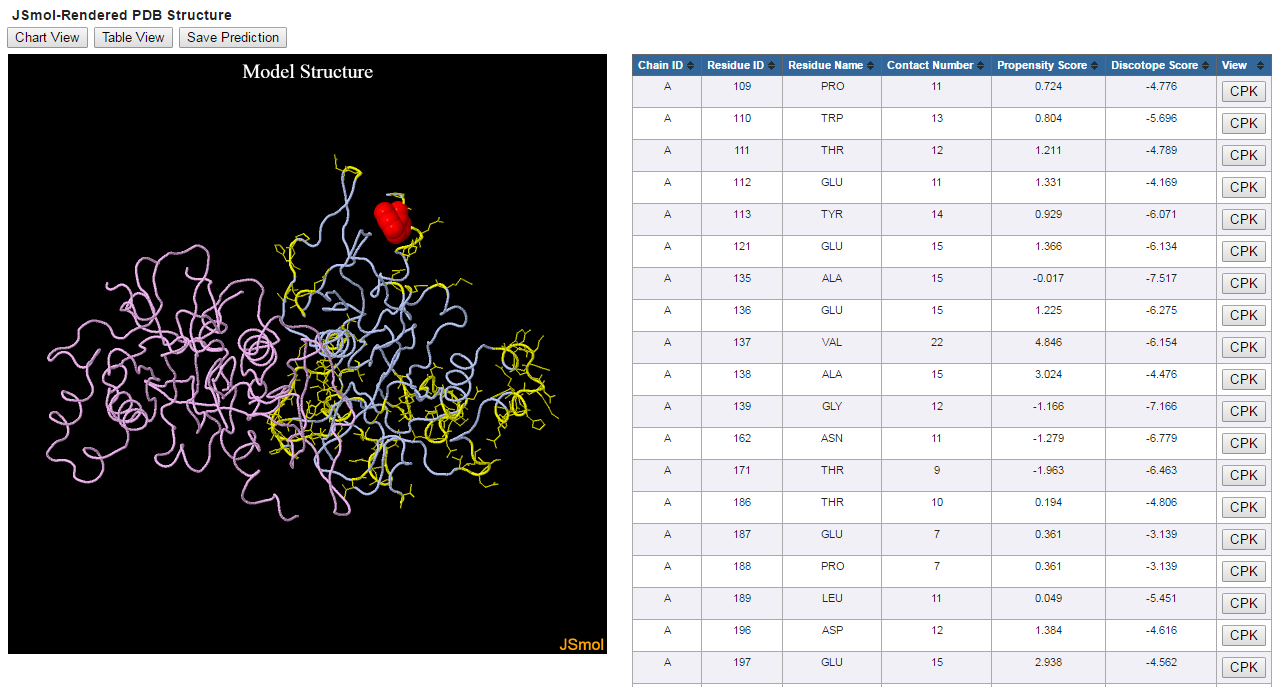
3D view
The 3d view uses Jmol to display the structure with positive predictions highlighted in yellow. The side chain of each predicted residue is shown.
You can rotate, zoom and manipulate the structure by using different buttons on the mouse. The table lists the predicted epitope residues along with
their chain id, residue id, contact number, propensity score and DiscoTope score. Clicking on the CPK button in each residue will highlight this residue
in CPK on the 3D viewer.
[Final version of Discotope 3D img. to follow]