Proteasomal Cleavage Prediction - Tutorial
NetChop/NetCTL/NetCTLpan
Introduction:
NetChop is a predictor of proteasomal processing based upon a neural
network. NetCTL is a predictor of T cell epitopes along a protein
sequence. It also employs a neural network architecture. NetCTLpan is
an update to the original NetCTL server that allows for prediction of
CTL epitope with restriction to any MHC molecules of known protein
sequence.
Input:
Step 1: Select either NetCHOP, NetCTL or NetCTLpan method.Step 2: Either paste sequence(s) in FASTA format in the textarea shown, or click browse and submit a file in FASTA format.
Step 3: Depending on what method is selected, enter the parameters for the program or leave the default values.
The Step 4 for each individual methods and their expected results are given below.
NetChop:
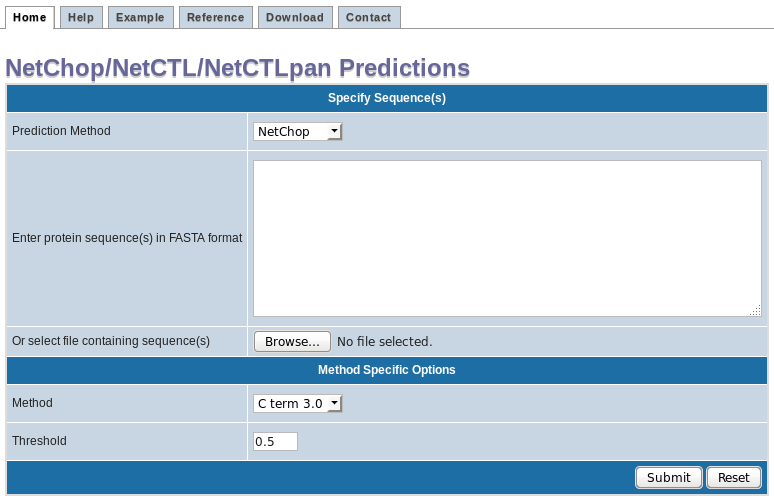
* NetChop input screen-shot
Step 4: Click on submit.
Output:
The following shows the predicted continuous epitopes as a chart of
NetChop score Vs. residue position. You can change the
threshold for predictions, view results in table format, save the
prediction result or start with a new prediction. The positive
predictions are displayed in green, while the predictions below the
threshold value are in red.
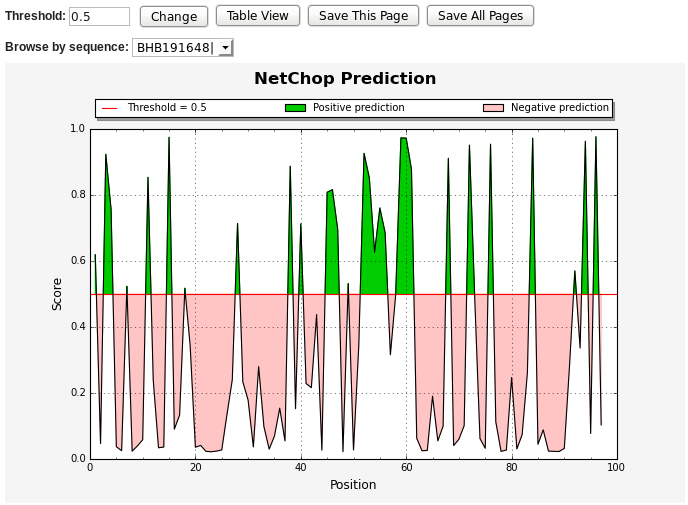
* NetChop output graph
The table below shows the tabular view of NetChop prediction result. Again, the positive predictions are displayed in green font.
- # - residue position
- Amino Acid - Amino acid residue
- Prediction Score - NetChop prediction score
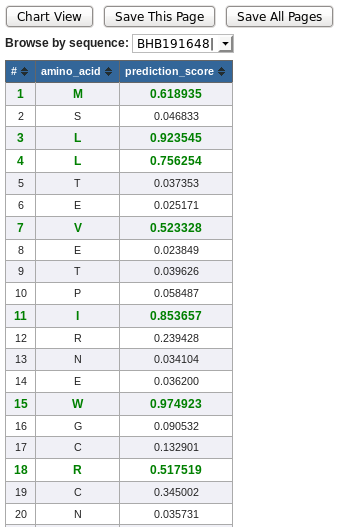
* NetChop output table
NetCTL:
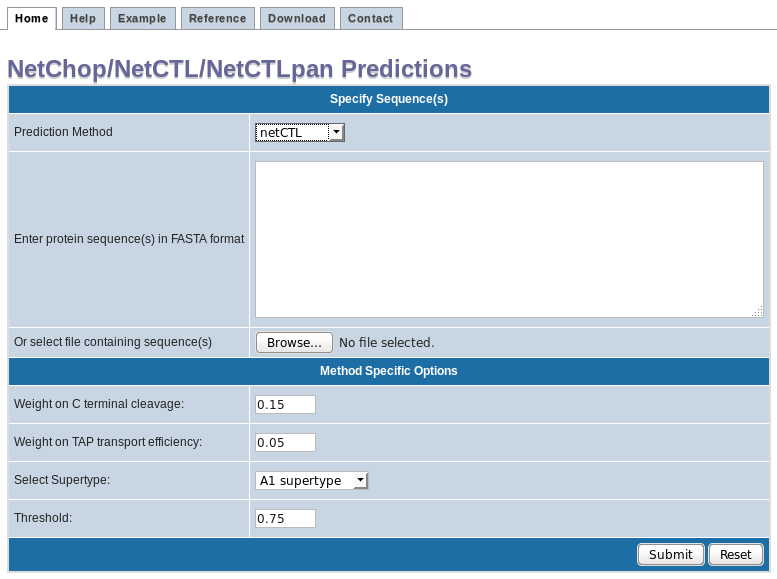
* NetCTL input screen-shot
Step 4: Click on submit.
Output:
The chart below shows the predicted continuous epitopes of NetCTL score
Vs. residue position. You can change the threshold for
predictions, view results in table format, save the prediction result
or start with a new prediction. The positive predictions are displayed
in green, while the predictions below the threshold value are in red.
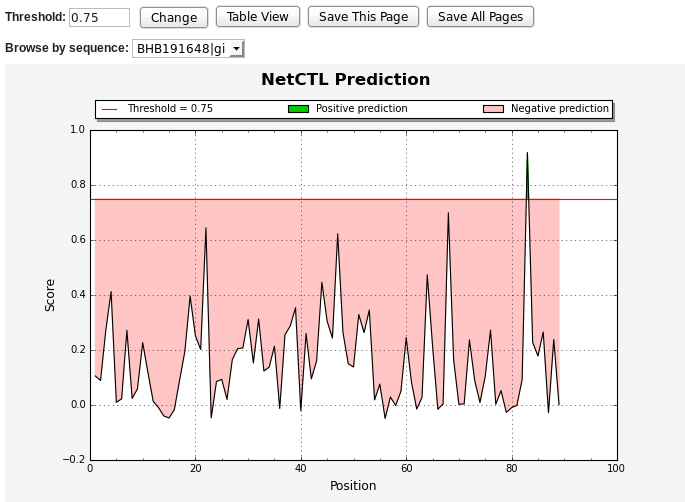
* NetCTL output graph
NetCTL table view lists following columns. The positive predictions are displayed in green.
- # - residue position
- Peptide Sequence - Amino acid residue
- Predicted MHC Binding Affinity - The value is given as 1 - log50k(aff), where log50k is the logarithm with base 50.000, and aff is the affinity in nM units
- Rescale Binding Affinity - The predicted binding affinity is normalized by the 1st percentile score
- C Terminal Cleavage Affinity - Predicted proteasomal cleavage score
- TAP Transport Efficiency - Predicted TAP transport efficiency
- Prediction Score - Overall prediction score
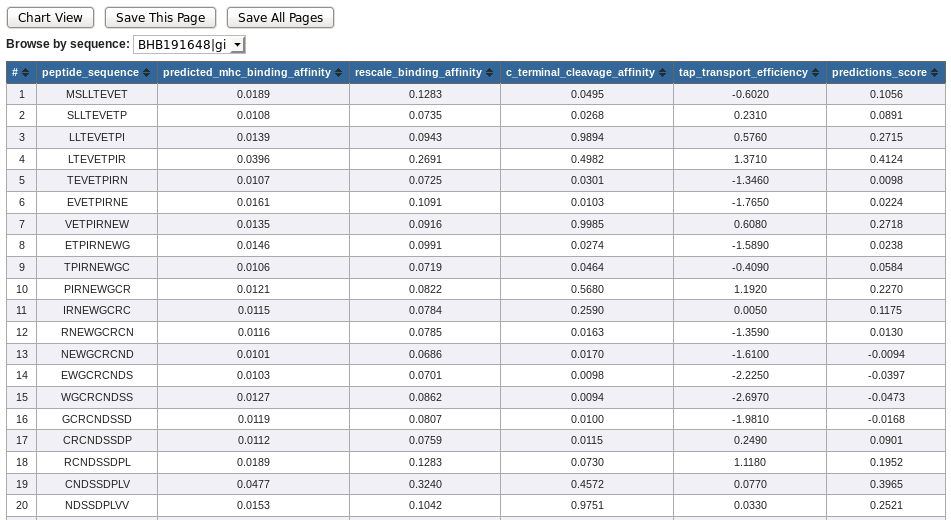
* NetCTL output table
NetCTLpan:
Addition options:
Frequently occurring alleles check-box:
By default "Show only frequently occurring alleles" check-box is checked. This allows the selection of only those alleles that occur in at least 1% of the human population or allele frequency of 1% or higher. However, un-checking the check-box will allow selection of all the alleles and corresponding peptide lengths for a particular species.
* Note that some of the HLA alleles are denoted with the supertype they represent, in parenthesis.
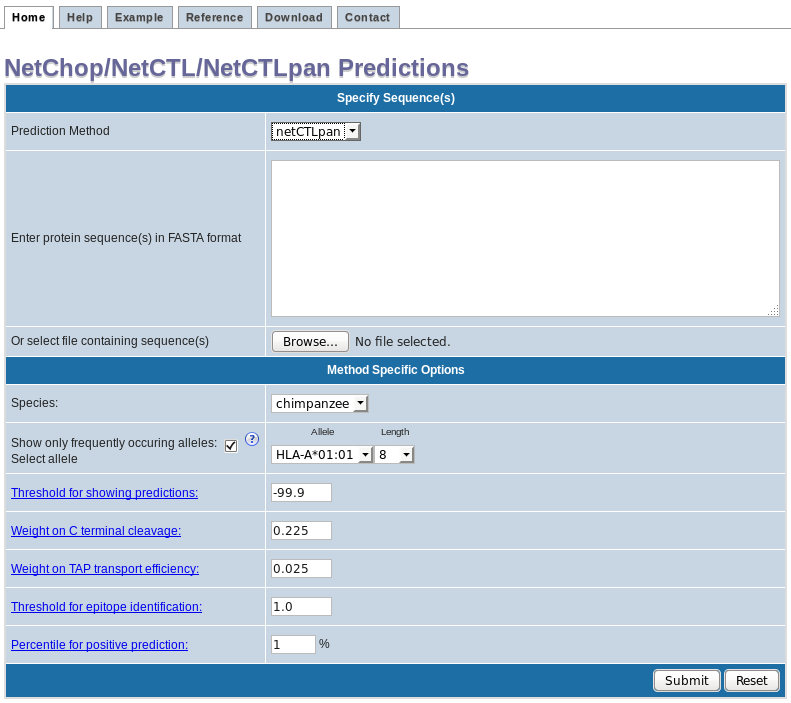
* NetCTLpan input screen-shot
- Threshold for showing predictions: This threshold filters the combined prediction score and displays only those that are greater than the threshold.
- Weight on C terminal cleavage: Relative weight on proteasomal cleavage.
- Weight on TAP transport efficiency: Relative weight on TAP transport efficiency predicted using weight matrix based method describe by Peters et al., 2003.
- Threshold for epitope identification: Threshold for epitope identification is the threshold to label predictions a epitopes. This threshold is based on the %rank score.
- Percentile for positive prediction: Percentile cutoff value for positive prediction.
Step 4: Click on submit.
Output:
The chart below shows the predicted continuous epitopes of NetCTLpan score
Vs. residue position. You can change the predictions percentile
threshold, view results in table format, save the prediction result or
start with a new prediction. The positive predictions are displayed in
green, while the predictions below the threshold value are in red.
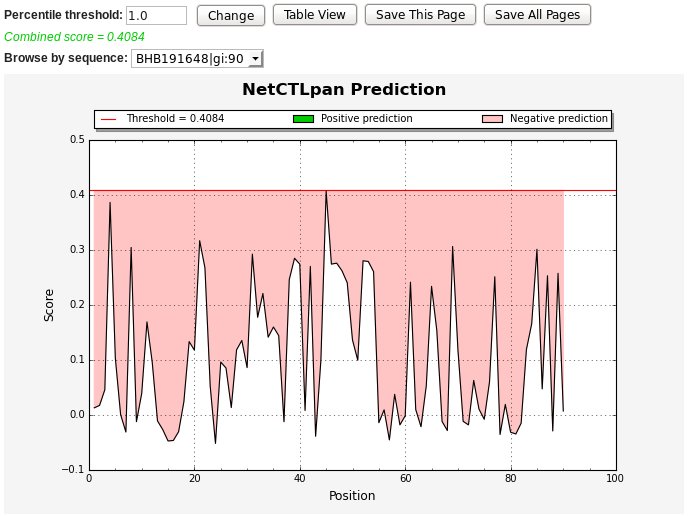
* NetCTLpan output graph
NetCTLpan table view lists following columns. The positive predictions are displayed in green.
- # - residue position
- MHC Prediction - MHC Prediction score (in 1-log50K(aff) uniqs)
- TAP Prediction score - Predicted TAP transport efficiency
- Cleavage Prediction score - Predicted proteasomal cleavage score
- Combined Prediction score - Overall prediction score
- %Rank - %Rank of prediction score to a set of 1000 random natural 9mer peptides
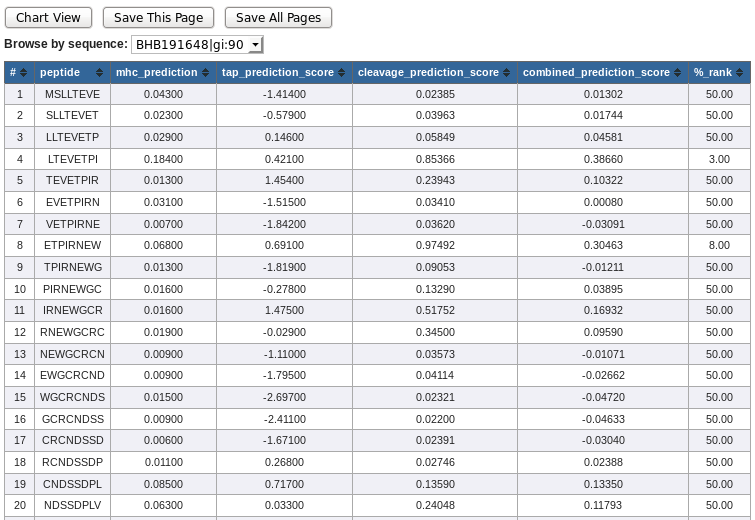
* NetCTLpan output table